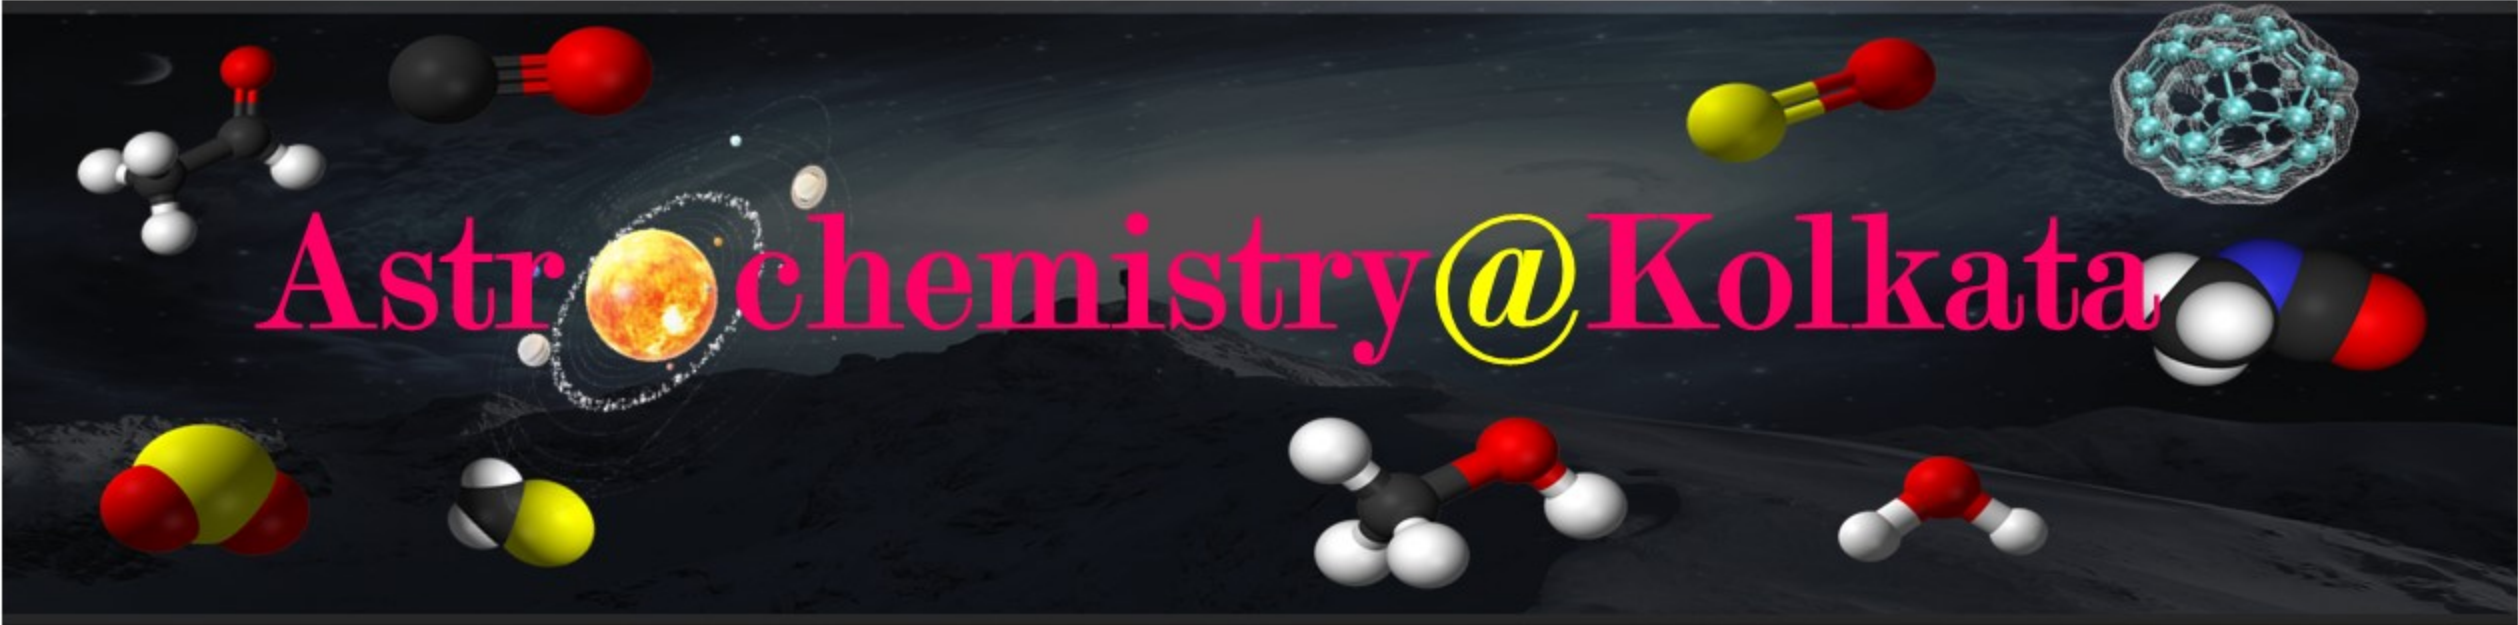
1. Star-forming region
Schematic view of the various stages of star-formation.
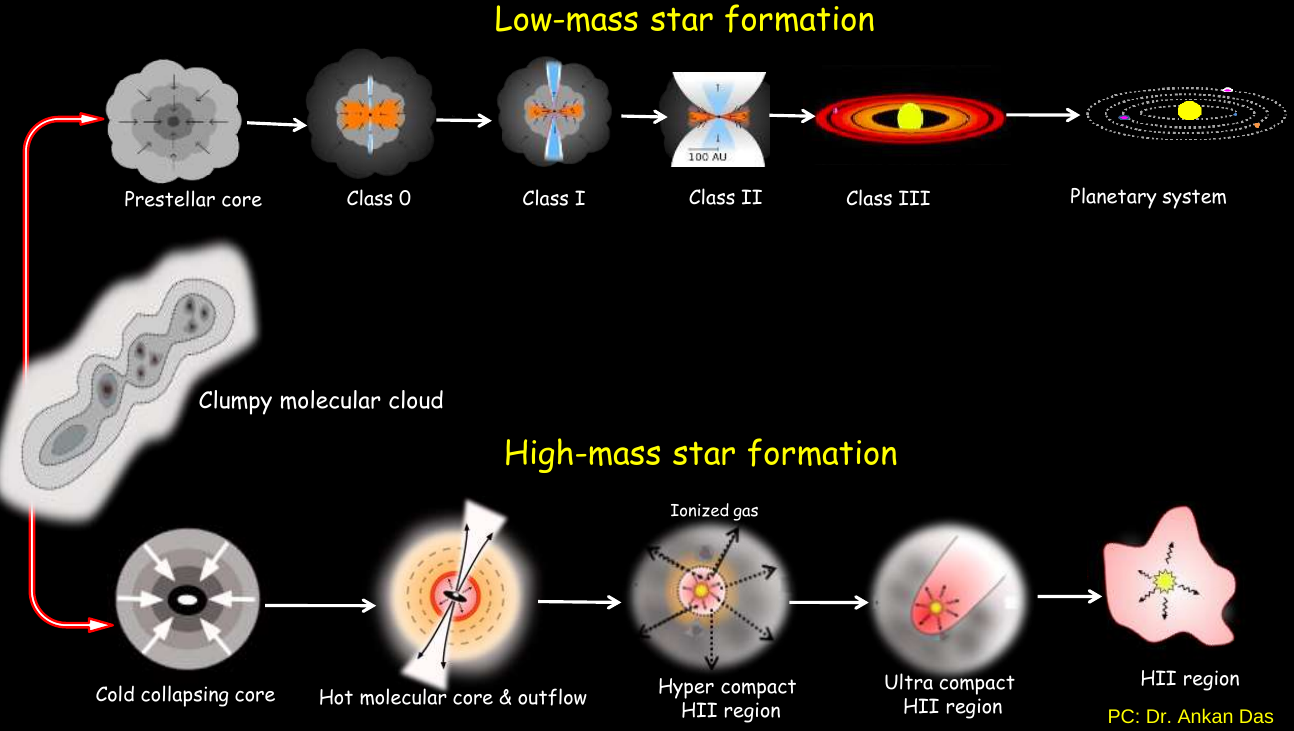
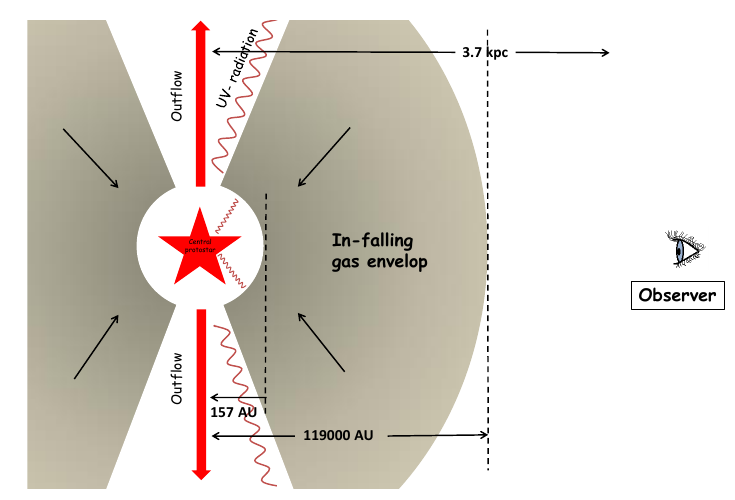
Schematic diagram of kinematics and molecular distribution in a hot molecular core, G31.41+0.31 based on present observational results obtained by our group(Gorai et al., 2021).
2. Radiation Dominated Regions
a. Crab nebula filamentary region
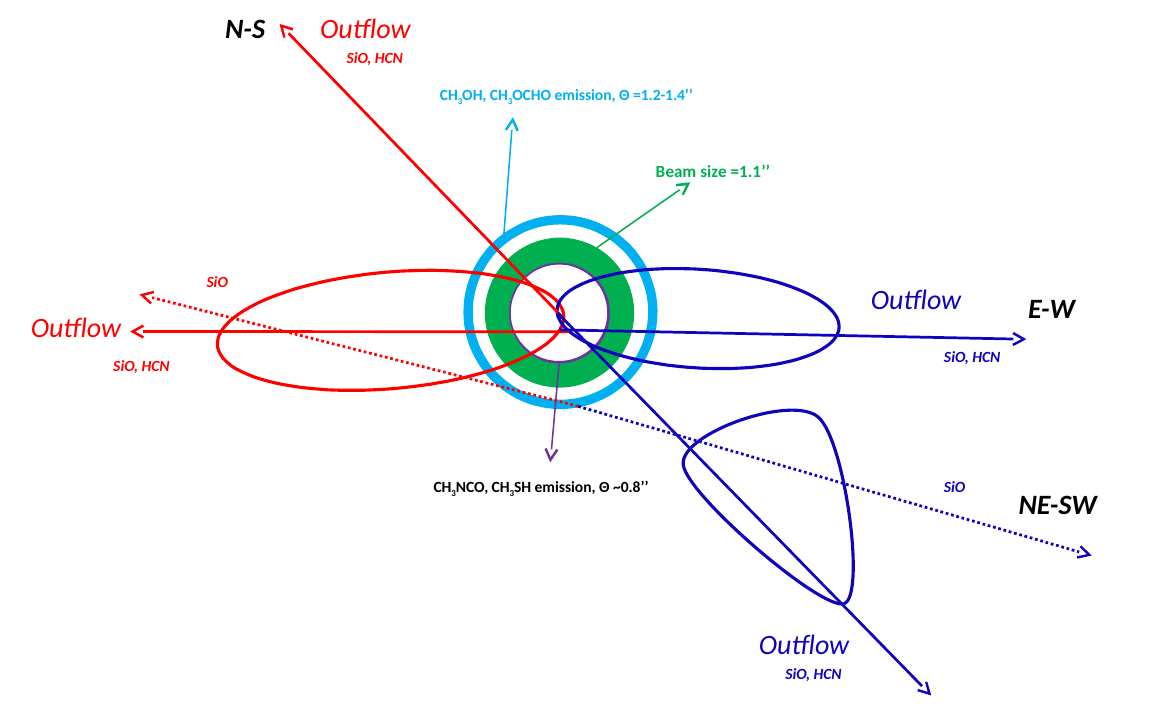
Parameter space for the intrinsic line surface brightness (SB) of 1-0 and 2-1 transitions of ArH+ , the 308 μm transition of OH+ , and 2.12 μm transition of H2. The right panel is marked with color coded values of the line SB (in erg cm-2 s-1 sr-1). The contours are highlighted in the range of observational limits(Das et al., 2020).
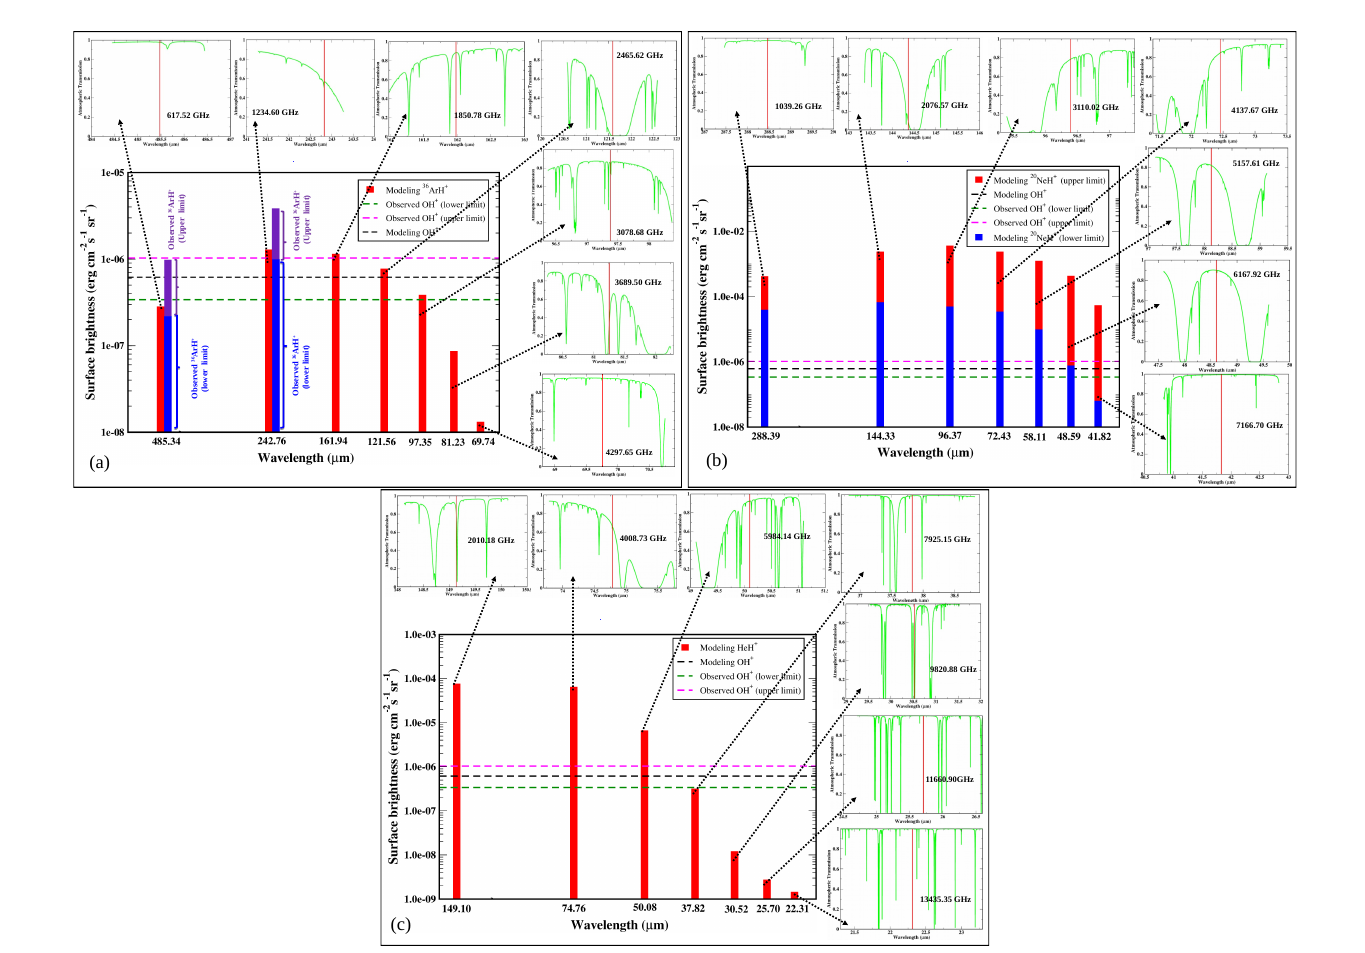
A comparison between the observed surface brightness of the 308 μm transition of OH+ and the transitions of (a) 36ArH+, (b) 20NeH+, and (c) HeH+ is shown (Das et al., 2020). The atmospheric transmission for each transition is shown to check the fate of their identification(Das et al., 2020).
b. PDR region

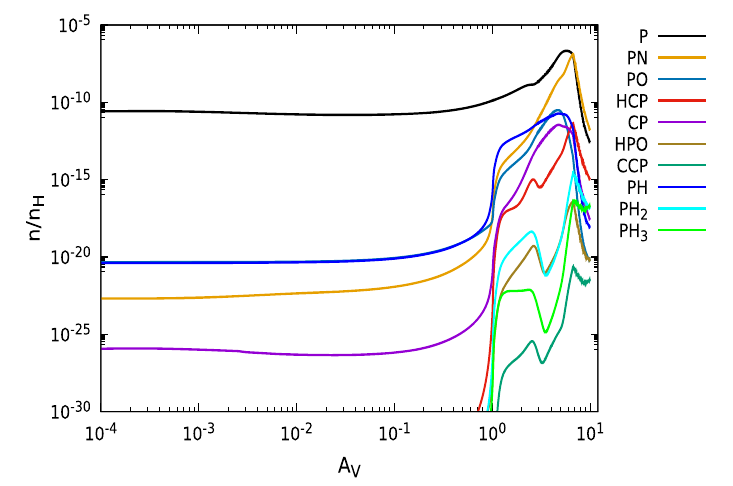
Chemical evolution of the abundances of H, H+, H2, H2+, H3+, e-, N, temperature profile and some neutral phosphrous bearing species for the PDR region are shown.(Sil et al., 2021).
C. Diffuse region
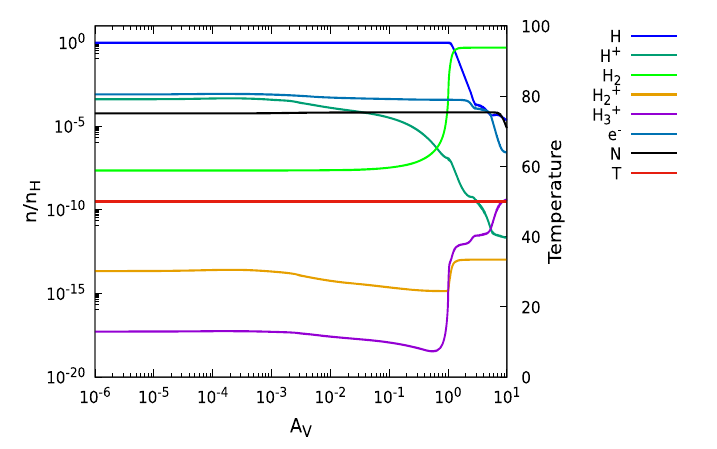
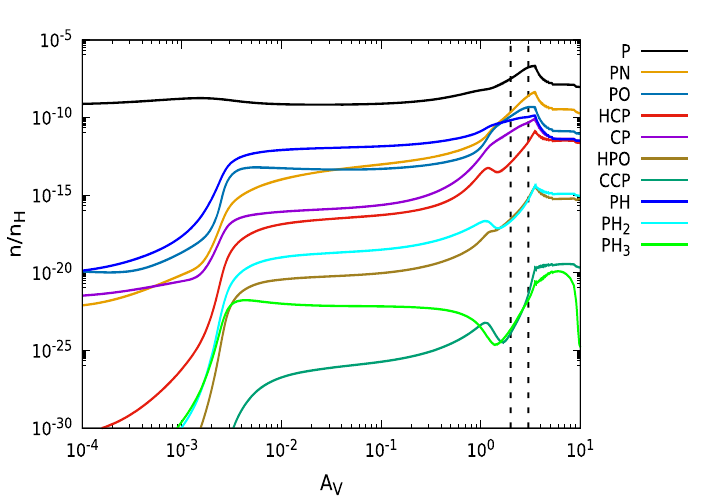
Chemical evolution of the abundances of H, H+, H2, H2+, H3+, e-, and N and temperature profile for the diffuse cloud (nH = 300 cm-3 and ζ = 1.7 × 10⁻¹⁶ s-1) are shown in the upper panel. The lower panel shows the abundance variation of the neutral P-bearing species. Here, the vertical dashed line indicates the visual extinction parameter of the best agreement between observation and model results(Sil et al., 2021).
3. Radiative transfer modeling
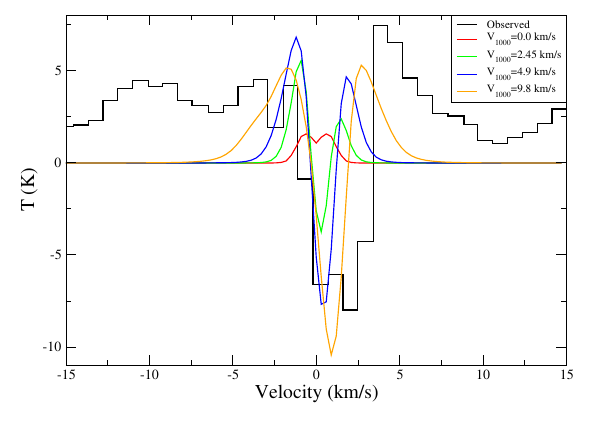
The upper panel shows the cartoon diagram to represent the modeled region of the cloud. The lower panle shows a comparison between the observed line profile (black line) and modeled line profile with a constant abundance of H13CO+ (7.07 × 10⁻¹¹ ). Different cases with the infall velocity are shown. It is evident that with the static envelope (red line), there is no asymmetry, and asymmetry increases with the increase in velocity. The best fit is obtained when an infall velocity of 4.9 km/s at 1000AU is used(Bhat et al., 2021).
4. Quantum chemical calculations
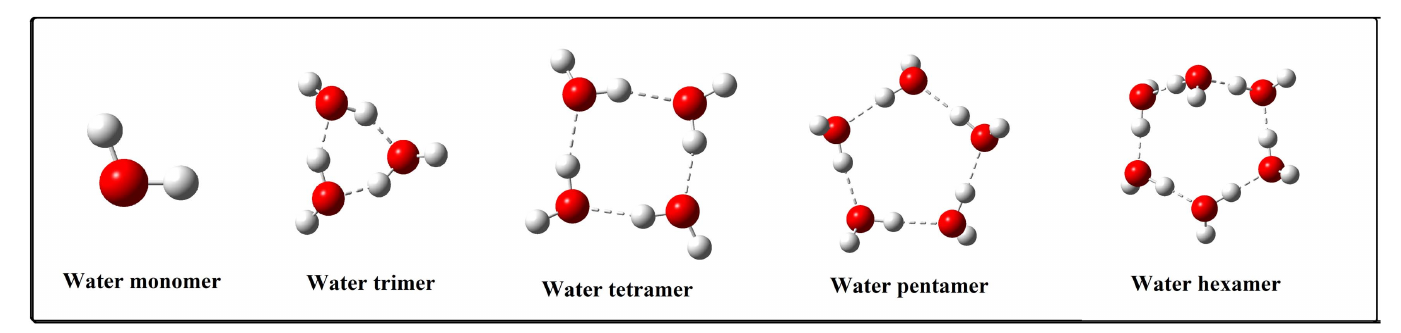
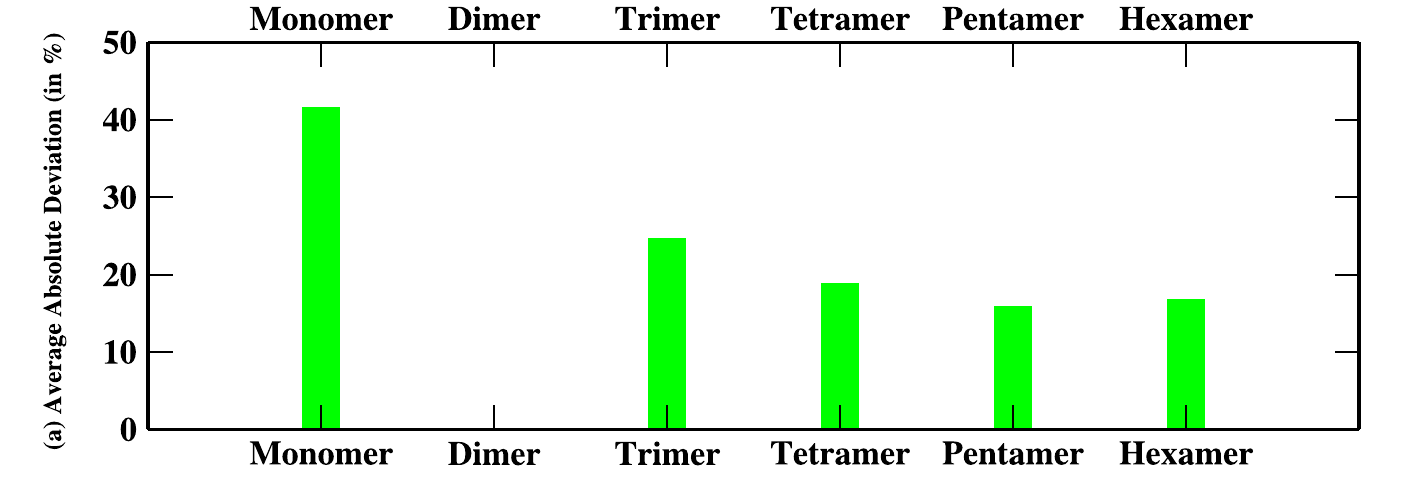
Average absolute percentage deviation our calculated binding energy values from experiment. Sequentially, one, three, four, five, and six water molecules are considered to represent water ice analogs in increasing order of complexity. We note that for most of the species considered here, as we increase the cluster size, our calculated BE value starts to converge toward the experimentally obtained value. More specifically, our computed results with the water c-pentamer (average deviation from experiment ∼±15.8%) and c-hexamer (chair) (average deviation from experiment ∼±16.7%) configurations are found to be nearer to an experimentally obtained value other than the value found for the water clusters we consider(Das et al., 2018).